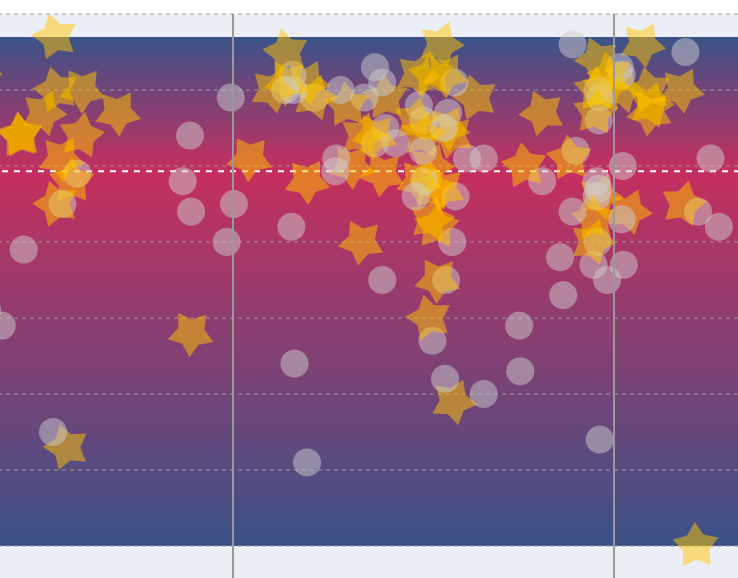
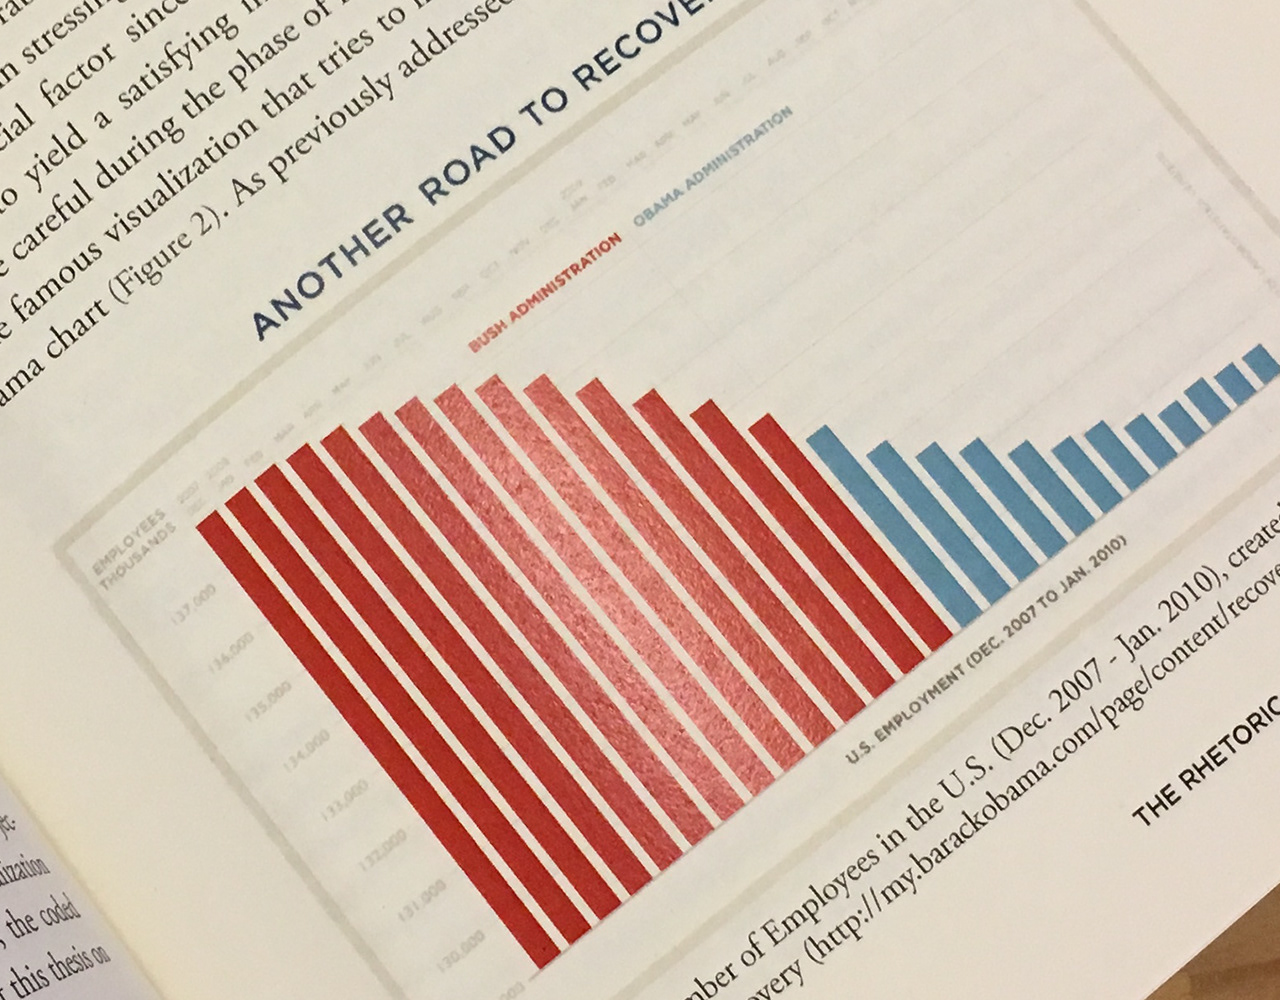
Data visualization
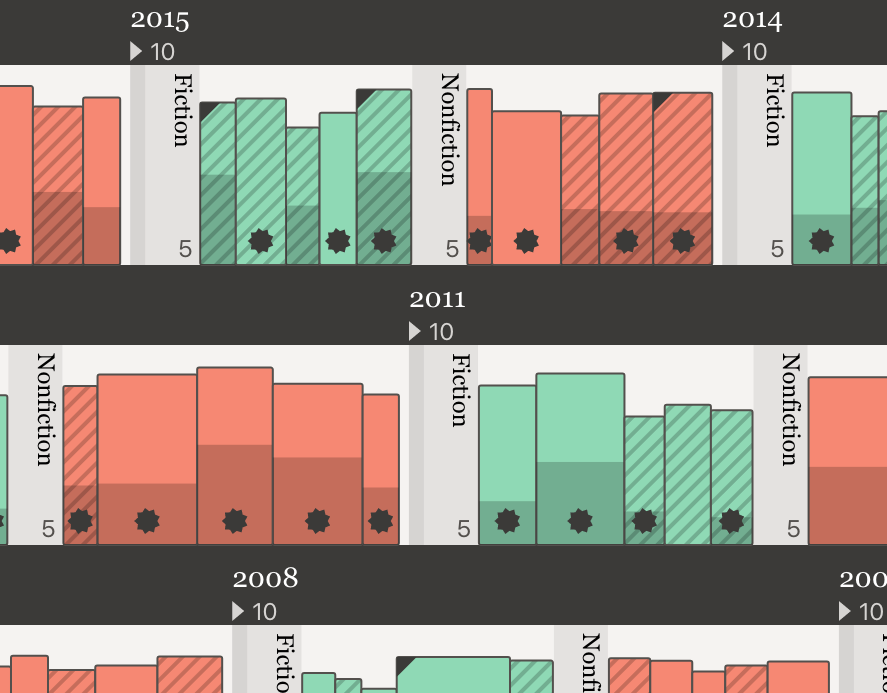
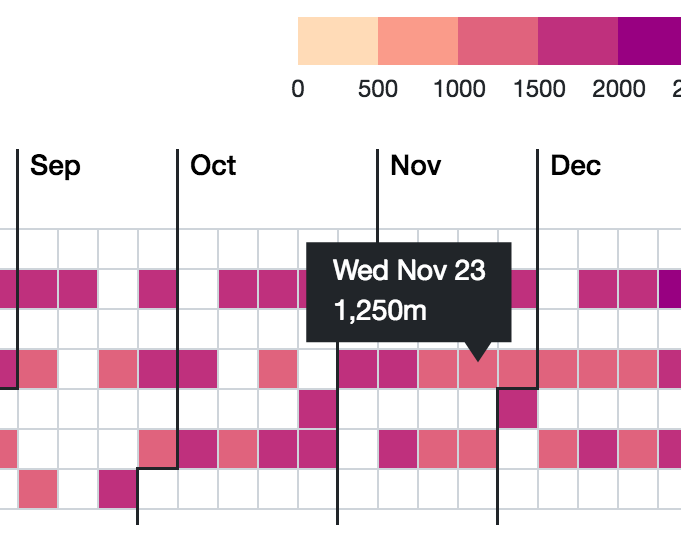
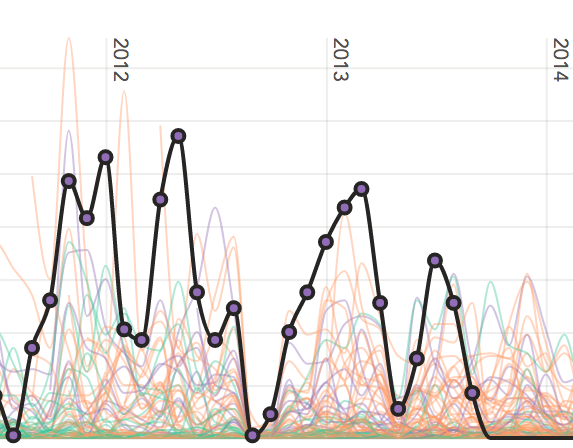
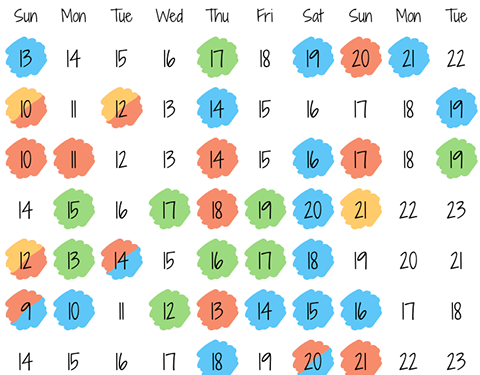
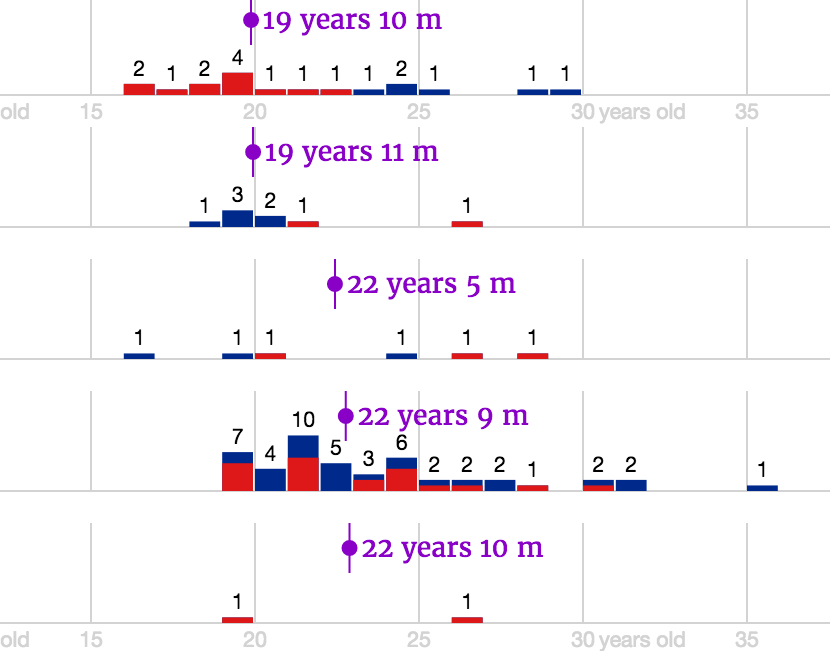
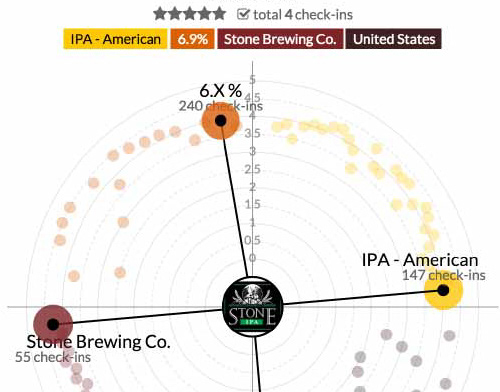
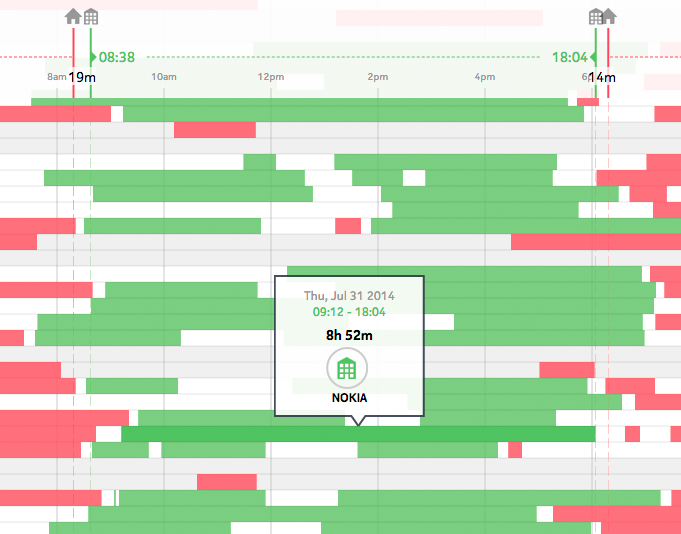
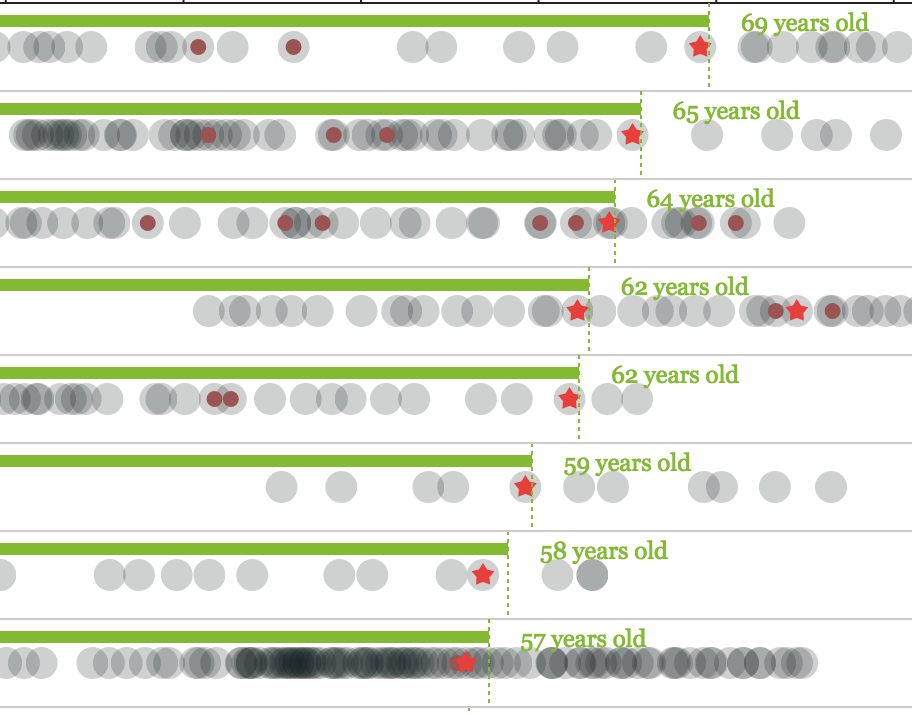
I’ve always been drawn to the visual expression of scientific rigor. As a designer with a math and science background, it felt natural to research data visualization during my PhD, and I’ve been building visualizations ever since.
No data arrives ready to be shown. I fetch and shape it first in SQL, Python, or R. For live data, I use GraphQL or REST. The micro-interactions come last. Search, filter, sort, and transform, built in React and D3, so complexity unfolds instead of arriving all at once.
That’s what makes a visualization more than a picture. Viewers find patterns and anomalies, build their stories, and come away knowing something they didn’t before. People always surprise me with insights I never noticed while building it.